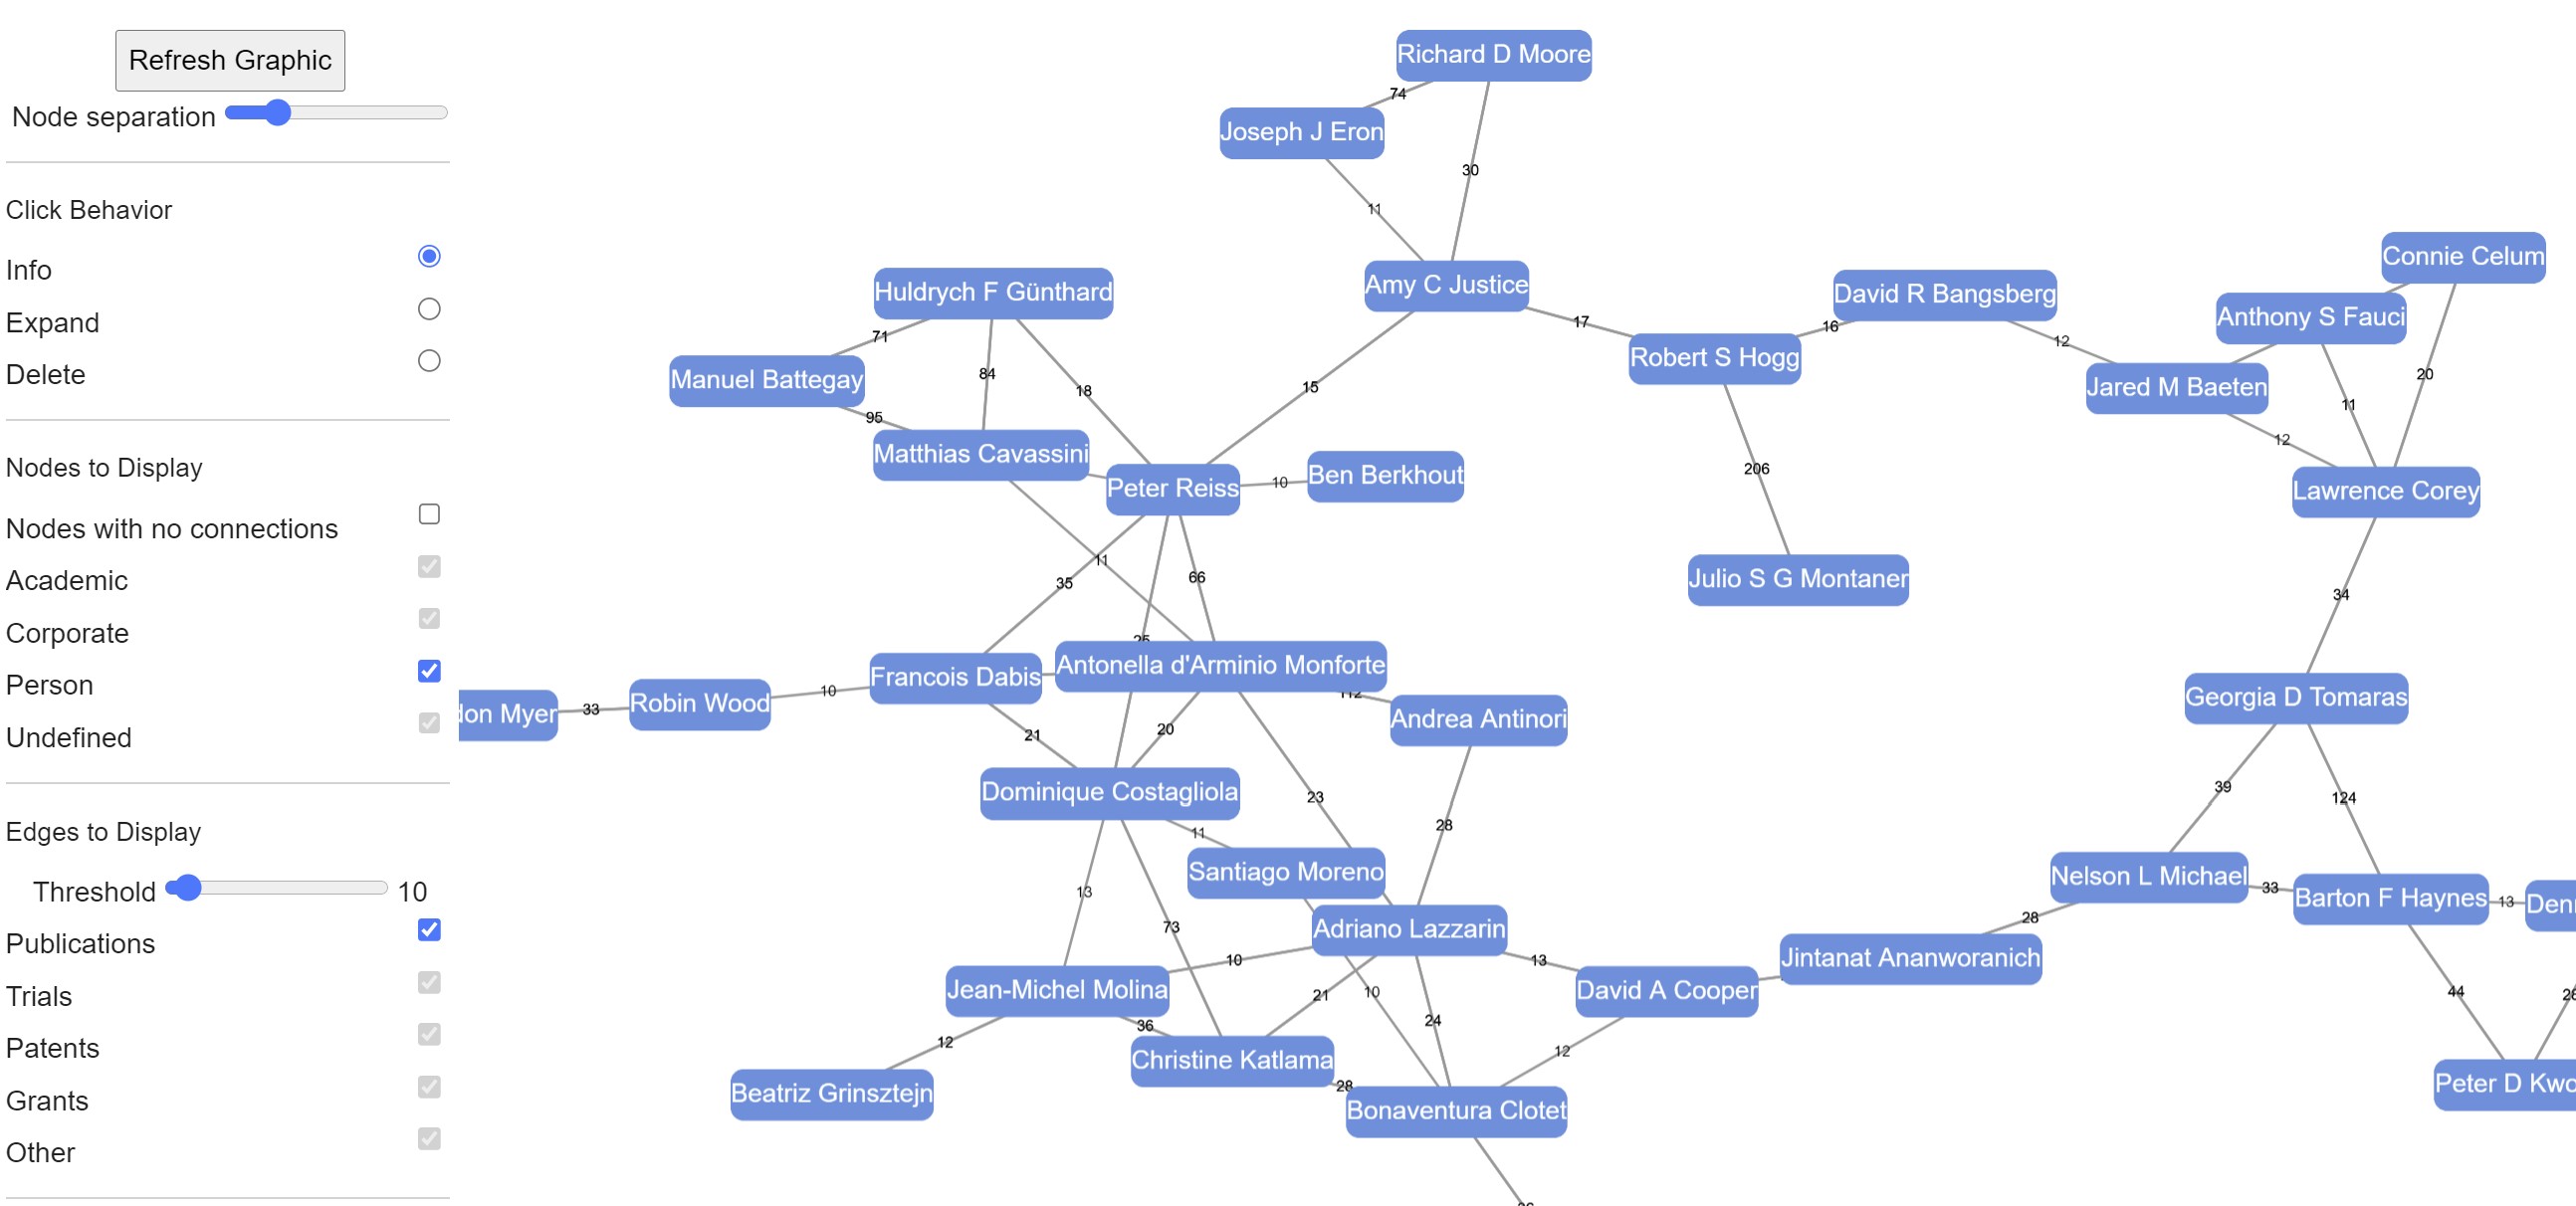
The RDATLAS network pages generate network diagrams of leading people and organizations based on a search topic. Above is an example of a network of authors of articles on HIV. Each node in the network represents a person or, in other network diagrams, an organization. Clicking on the node will show more details about each. The edges connecting the nodes represent connections between the nodes. Depending on the type of network, these may be publications, clinical trials, patents, grants or other associations, such as employment or consulting roles between individuals and companies. The filter panel on the left allows specific subcategories of nodes and interactions to be displayed.
There are three basic types of network diagrams available:
- Co-author publication network
- A network of authors with the most publications on a specific subject linked by the number of publications they have in common
- Organization publication network
- A network of organizations with the most publications on a specific subject linked by the number of publications they have in common
- People-organization network
- A network of authors with the most publications on a specific subject along with the top organizations that these authors are associated with either through publication, clinical trial, patents or grant affiliations or through other direct interactions such as employment or formal advising roles. Note: the network generated does not represent a complete list of interactions but rather represents a version that has been simplified to provide a high level perspective on the landscape. Contact Integrated Profiling, LLC for more detailed analyses.
depicting the interactions between people and organizations